Elevation profiles are misleading
TL;DR
Average grade over long routes hides nasty short climbs. I wrote a script that calculates gradient every 50m and color-codes the elevation profile, so you can actually see the painful bits.
I’m training for the Camino de Santiago on a bike. I live in Barcelona and only have a single-gear bike, which means steep hills = death for my knees. So I’ve been looking for good route-planning tools that don’t lock everything behind paywalls.
This is where my research on tools and apps to plan routes began. I want to avoid the usual suspects with paywalls and have been looking for self-hosted, open-source alternatives. I found this amazing tool Wanderer, installed it on my home server, and started creating routes. This was my first attempt:
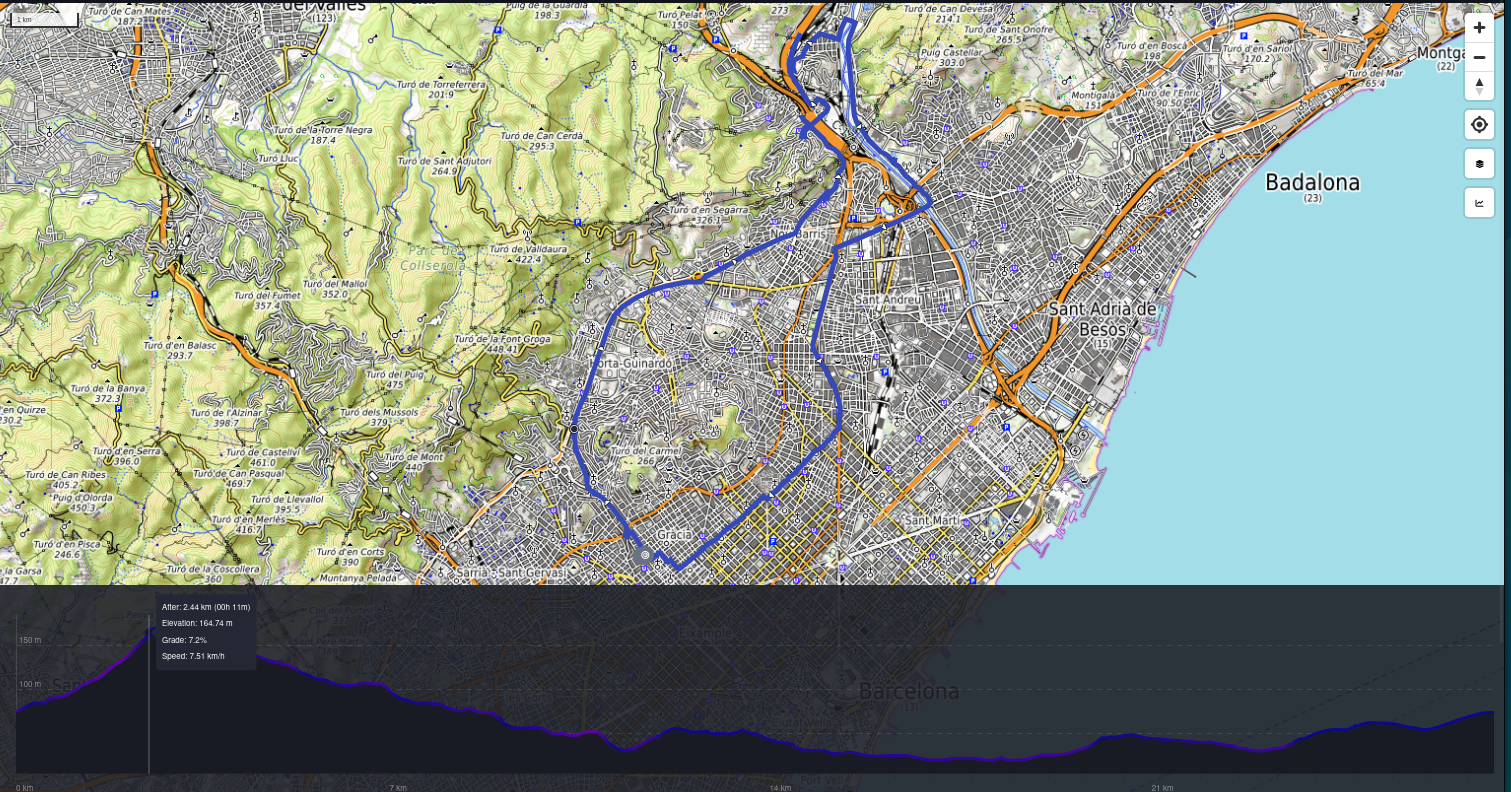
There’s a hill at the beginning, but it seemed doable — a maximum grade of 7.2%. Reality check: the hill in general was OK, tough but doable, but at the very end the climb gets insane. After doing the route, there were several things I wasn’t pleased with; for instance, one bit of the route seemed too dangerous. But for now the most worrying part was being able to plan longer routes without trusting the route profile.
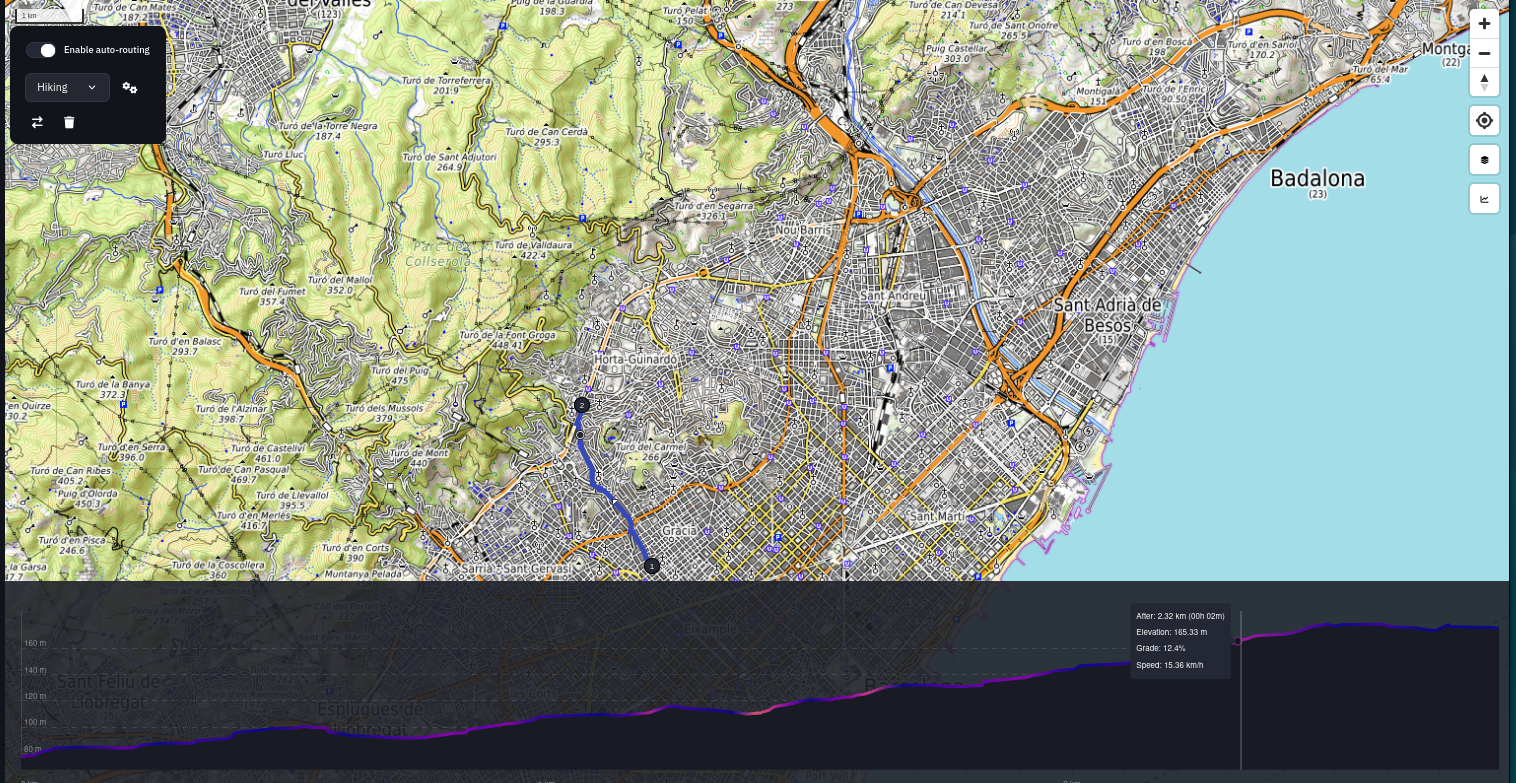
Looking more closely at the hill, the last bit shows a 12.4% grade — not cool for a gear-less bike nor for my knees.
I started wondering: how can I prevent this? I dug into tools, blogs, and all kinds of information about bike climbs. After a lot of research, I couldn’t find a reliable way to know in advance whether I’d suffer or have to step off my bike and walk those bits — which, for me, defeats the purpose.
Even official routes weren’t enough. For example, EuroVelo gives official routes and categorizes them by how developed they are. That’s an awesome starting point, but still doesn’t tell me whether I could handle a long trip. I exported the GPX from the EuroVelo Catalonian Cross and plugged it into Wanderer.
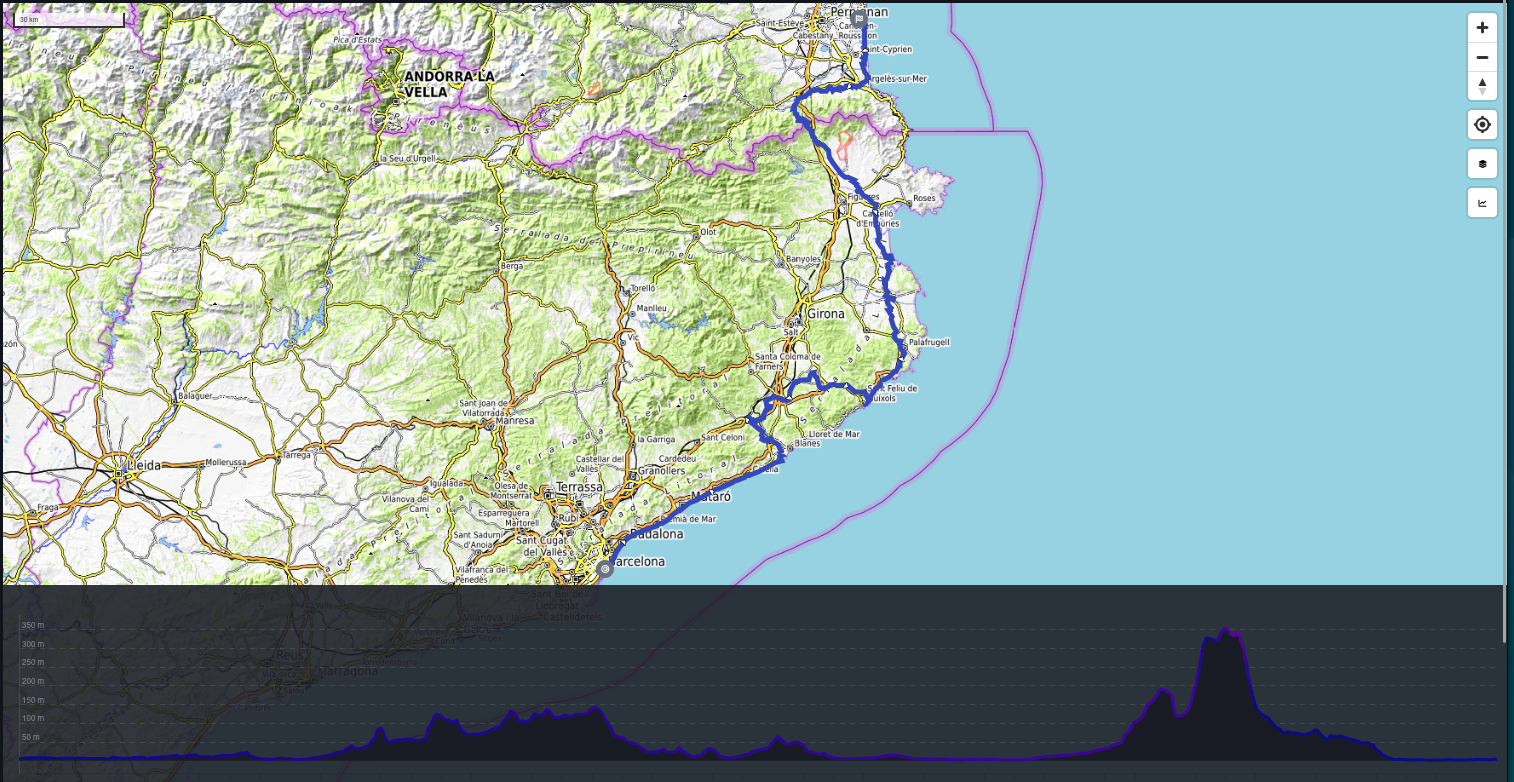
The route looked fine, but the bit at the end (Spain/French border) seemed to have quite a climb. Looking at the elevation, it’s only 400 meters, and hovering the mouse showed a max grade of 4.9%. Sounds perfect. But now, having learned my lesson, I know that average grades over long distances are misleading.
I decided to take a closer look. The only problem: having to cut the route profile and extract the section of interest. So I wrote a Python script to give me all the details I needed without jumping between tools.
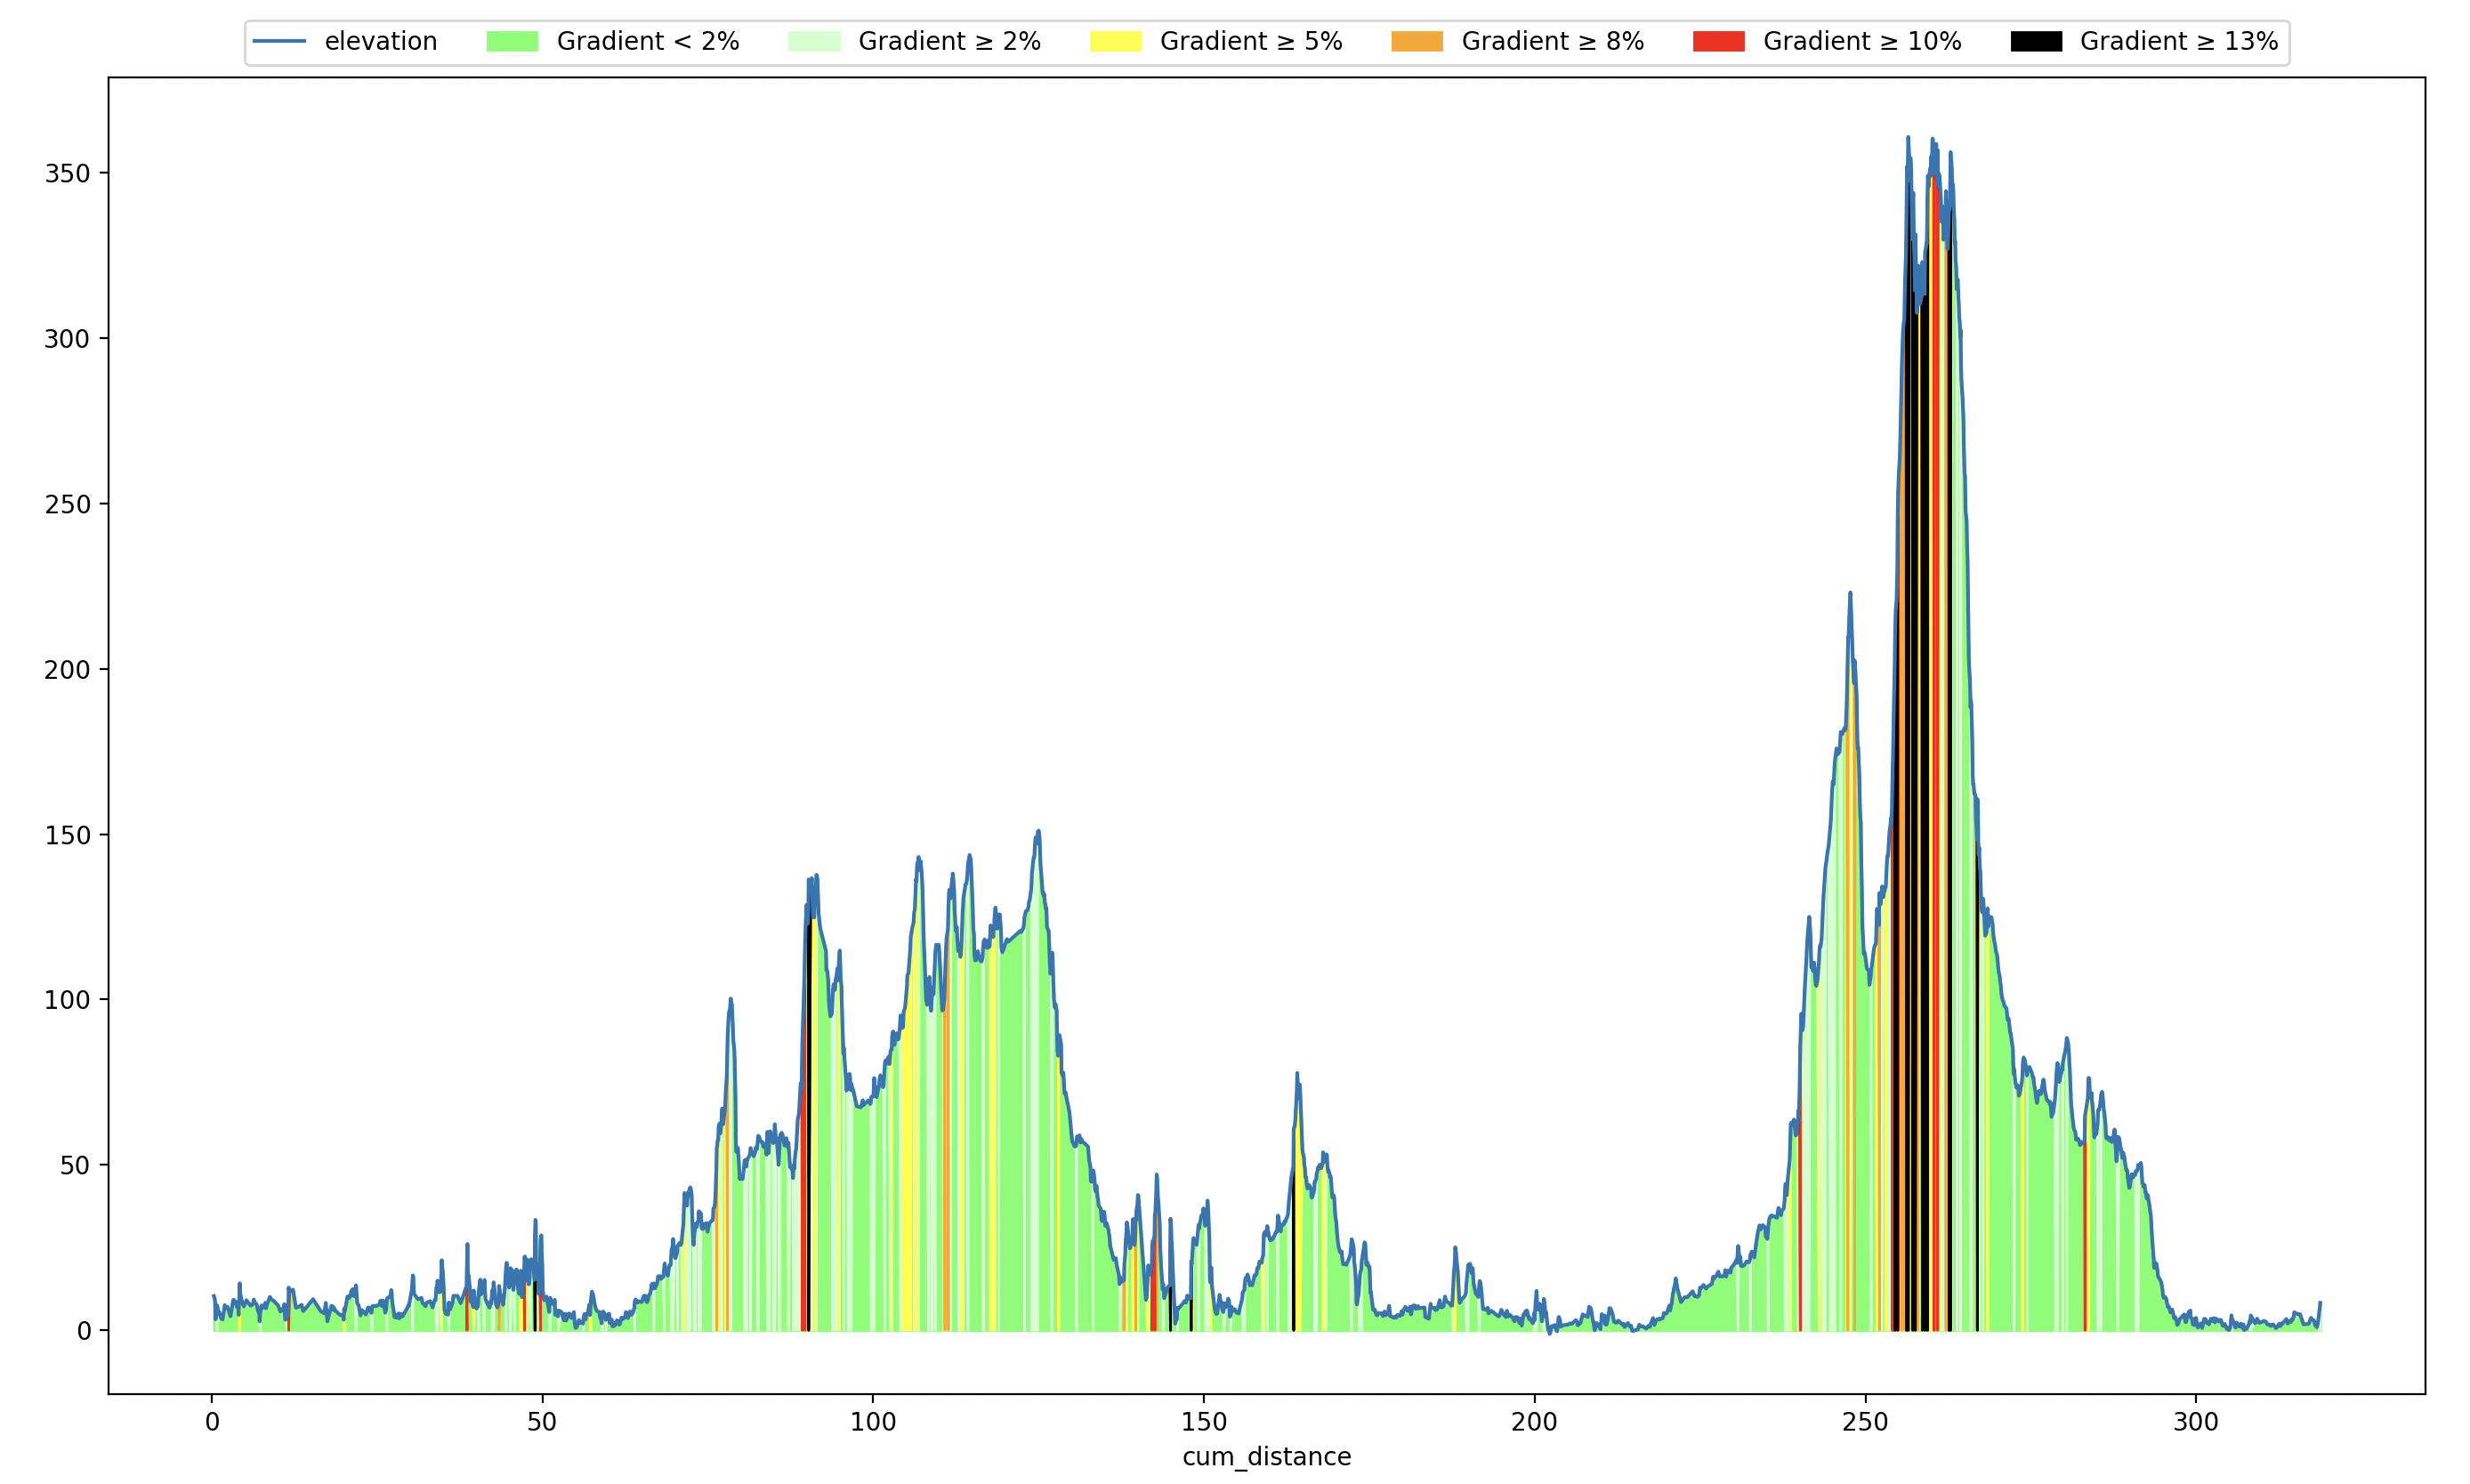
The script calculates the gradient every 50 meters and colors the area below depending on grade level. That way, I can now see that part of the route has several painful climbs — nothing like the misleadingly smooth 4.9% shown in Wanderer. There are even multiple red-zone chunks before the massive climb.
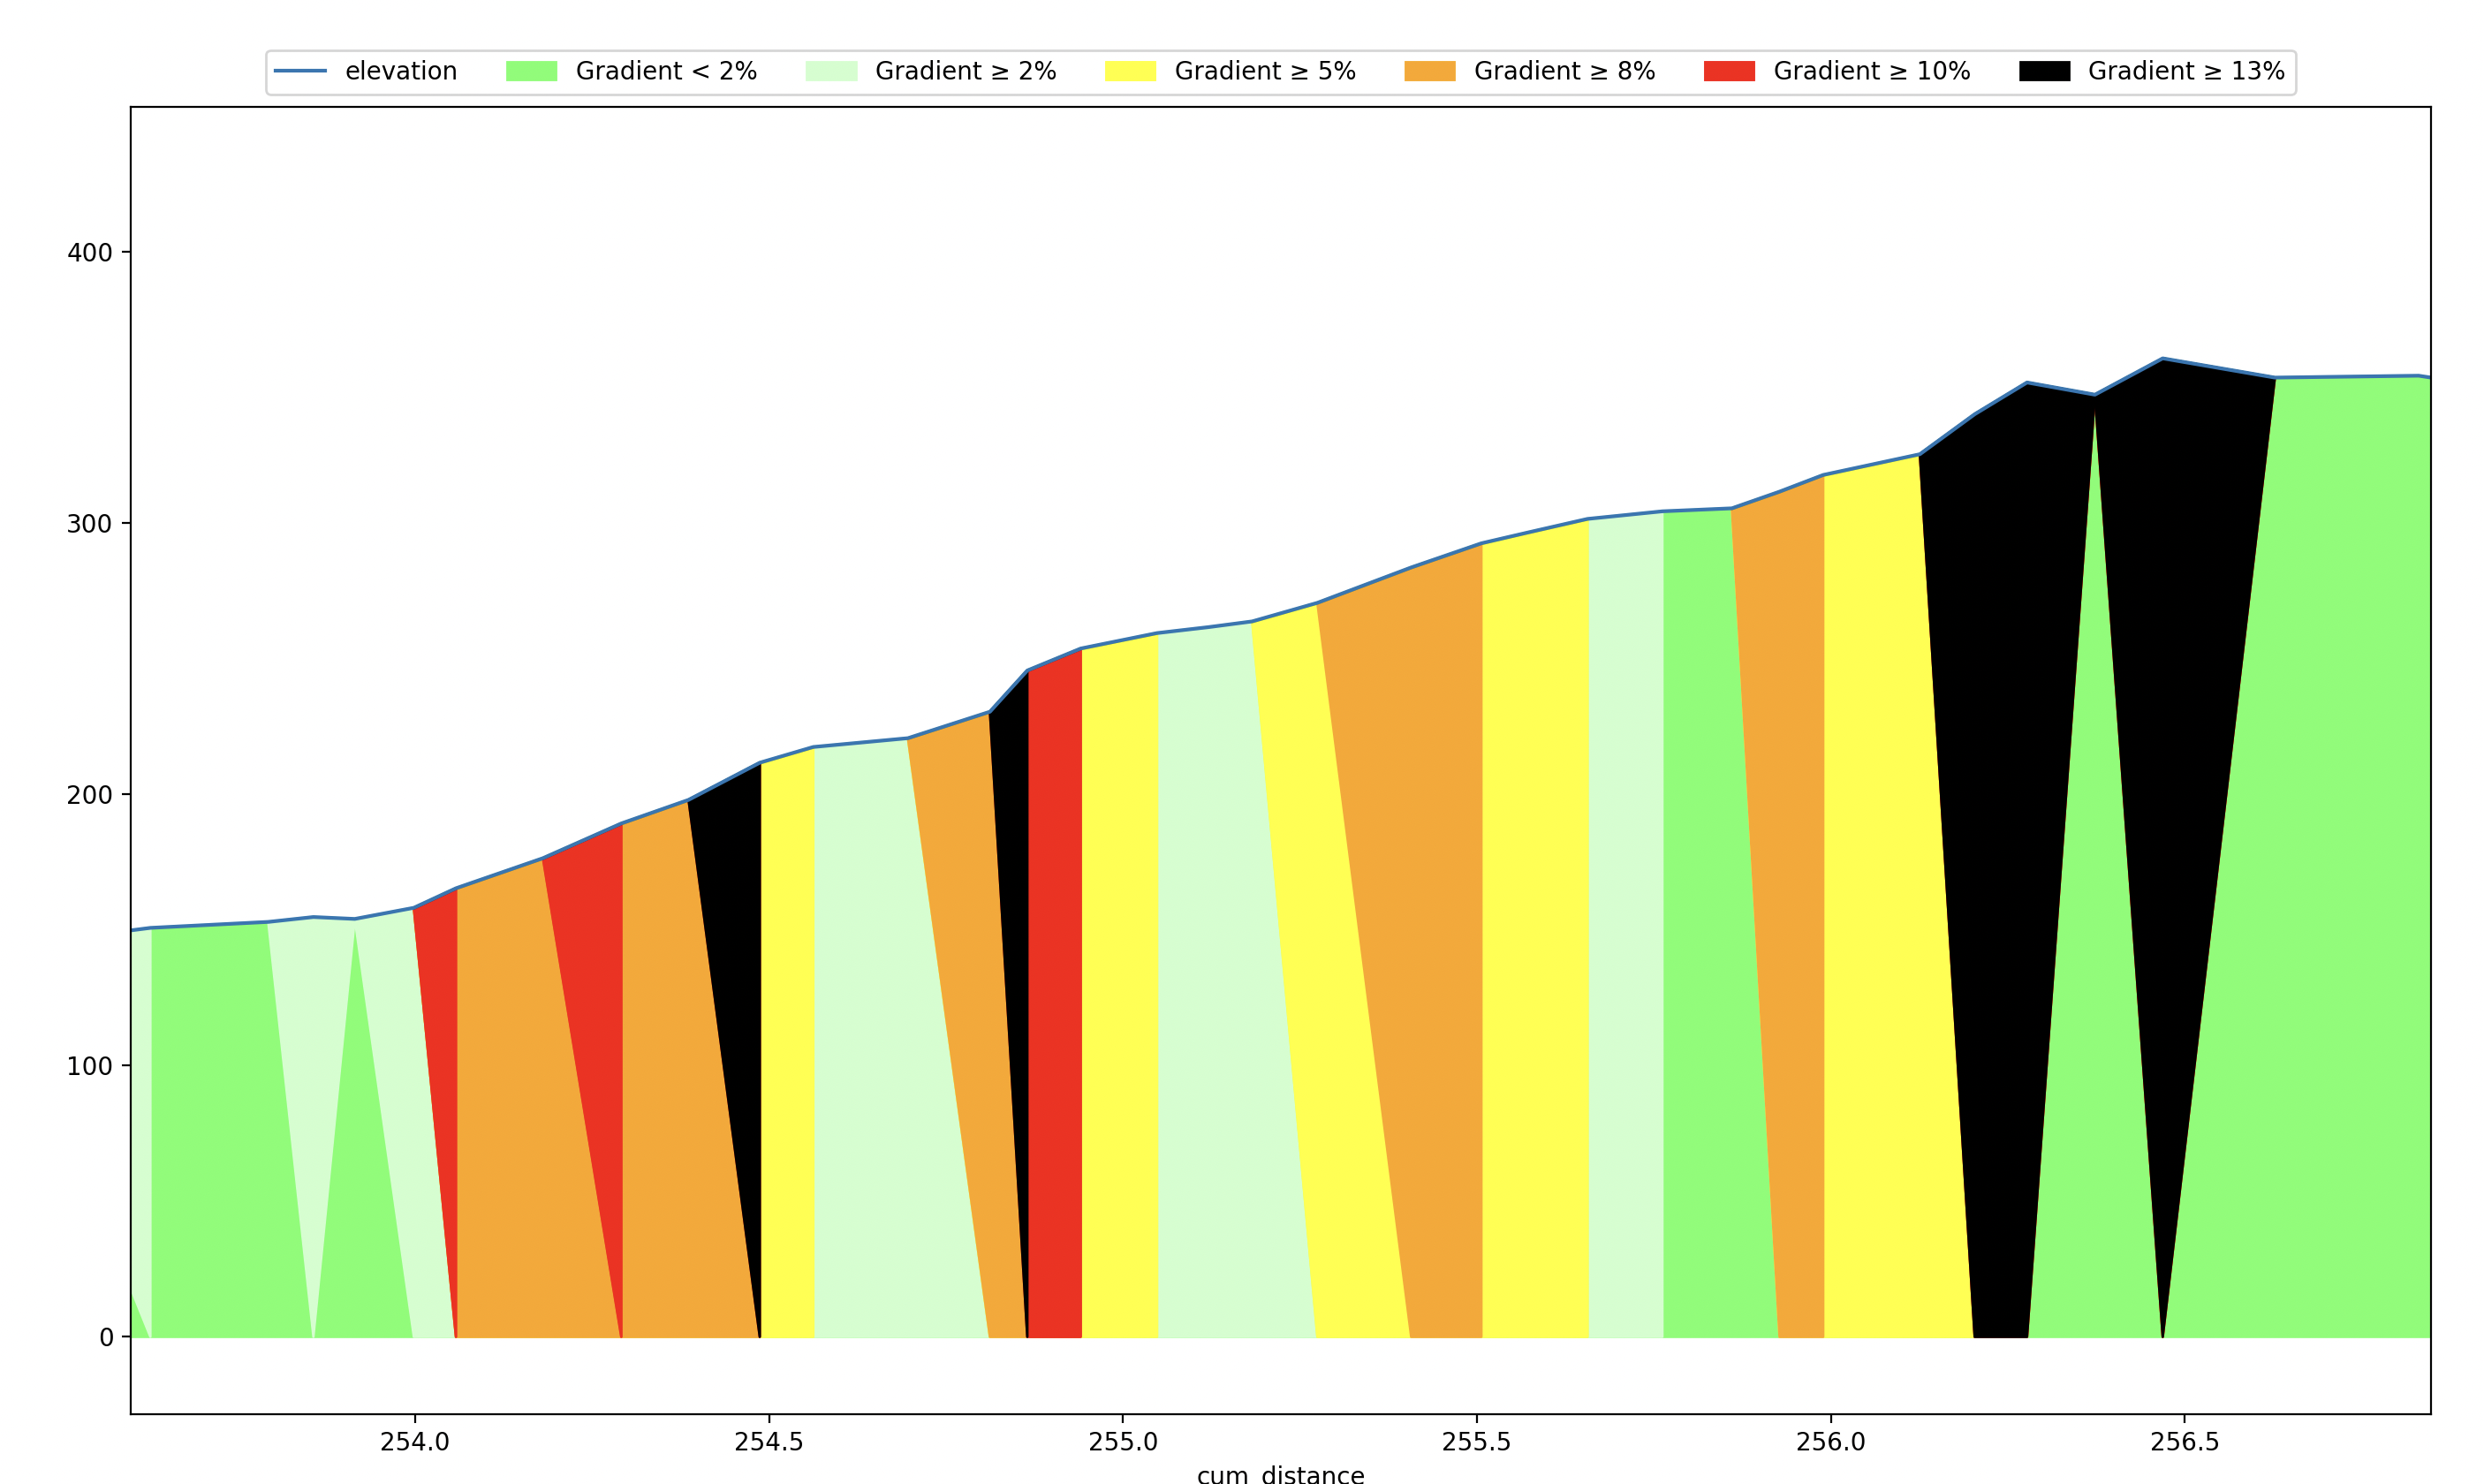
Zooming into the massive climb at km 255, I can see that for about 1 km the average is >10%. Definitely not doable on a gear-less bike, and probably even with the right bike my legs aren’t ready yet.
Now I know I can ride most of the Catalonian Cross except for this chunk. I also noticed that from km 80–120 there’s a nice hilly area that could be a good starting point for training before tackling tougher climbs.
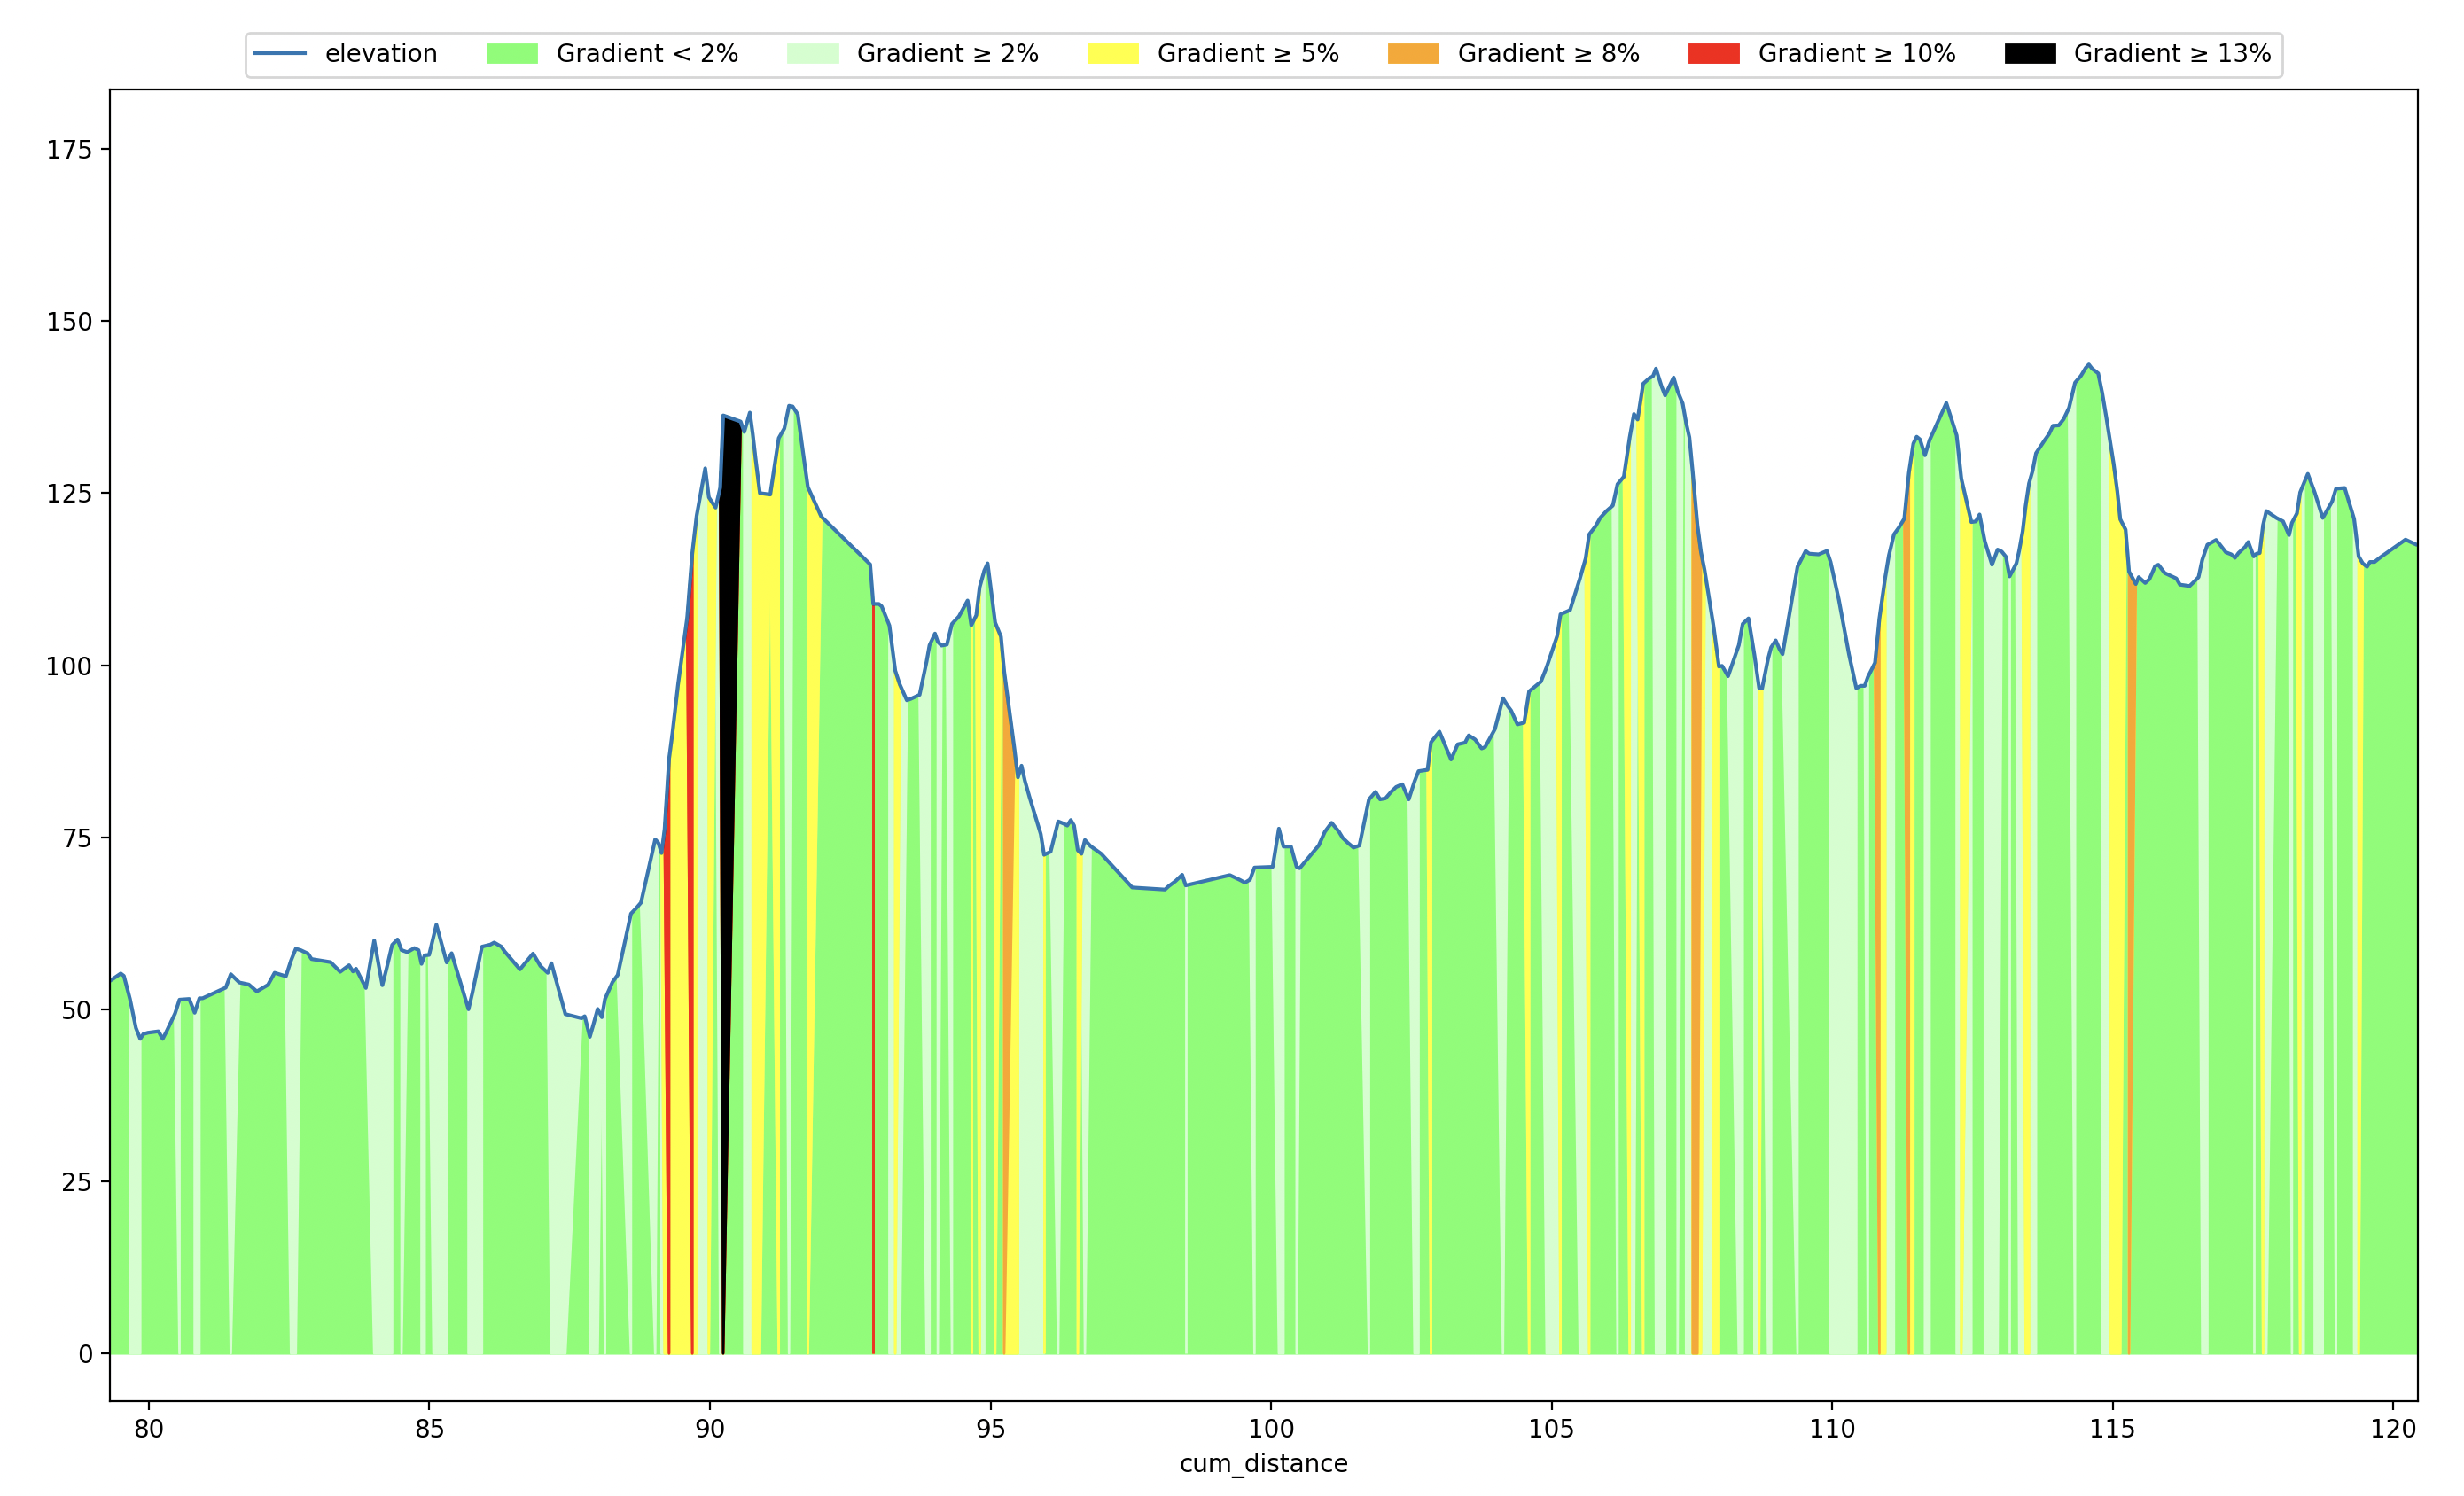
By plotting positive and negative climbs, I can see what seems easier, and going backwards looks like the best option. Now I only need to get there. Using Wanderer, I found that the closest train station to km 120 is Caldes de Malavella. The whole route has train stations relatively close (in case 120 km is too much for me).
So far I’ve done 60 km in a day without problems, so doubling that could be ambitious but possible. Looking forward to seeing how the ride goes!
If you’re interested in the code, you can find it here.
If you found this useful, please follow me on the Fediverse: @luis@write.dadadock.com for more posts like this.